Showing posts with label phoenix real estate market trends. Show all posts

Tuesday, January 24, 2012

PHOENIX REAL ESTATE MARKET REPORT - DECEMBER 2011


This data includes single family detached homes, patio homes, condos, and townhomes provided by the Arizona Multiple Listing Service. The monthly charts above are based on trailing twelve monthly averages from January 2011 to December 2011 which shows the total activity in the Phoenix Metropolitan real estate market over a twelve month period. The yearly charts above are based on a yearly average for 2005 to 2011.

As you can see from the first chart above, Position Realty Market Index, the first time home buyer tax credit created a great deal of demand in the market similar to the real estate boom from 2004 to 2006. When the government withdrew the first time home buyer tax credit on April 30, 2010, the average sold price and number of transactions decreased and the average days on market increased. Currently, the residential real estate market is experiences another buying frenzy that is caused without government intervention or relaxed mortgage underwriting standards. Consumers are jumping into the real estate market because market statistics are indicating the market has hit bottom and investors can purchase homes at rock bottom prices where they can rent the homes out to receive a 10% to 15% or more return on investment. In addition, the number of people losing their homes to foreclosure has caused an increase in the demand for rental properties, as can be seen in Chart #2. 

Due to the current oversupply of homes on the market, real estate prices have not increased significantly but as you can see from Chart #3 real estate prices have started to increase since October 2011. Once the supply of homes is purchased, real estate prices will start to increase at a faster pace and then it will be too late to buy. Since January 2011, the average sold price has increased approximately +3.7% (up from last month), the average days on market have decreased approximately -17.1% (down from last month) and the number of transaction has increased approximately +18.4% (up from last month). It should be noted that approximately +35% of all transaction are cash purchases either by investors or homeowners due to tighter lending requirements. The volume of REO purchases since January is down -22.9% and the volume of short sale is up +64.9%. The volume of REO purchases are shrinking due to the increased volume of trustee sales and existing supply of inventory is getting absorbed at a faster rate.        
  
The real estate market has reached a level of equilibrium where demand is equal to supply and all buyers are rushing into the market to take advantage of low prices. Once the supply of residential homes is exhausted and demand continues to increase, real estate prices will begin to rise (depends on the sustained level of demand). Trying to “time the market” for the perfect time to buy is nearly impossible but there is no better time than now to purchase. Real estate prices are at an all time low, mortgage rates are at a historical low and the market appears to be improving both in terms of prices and the overall economy. Time to buy is NOW!! Give us a call to discuss your best buying strategy, TODAY!!

Wednesday, April 6, 2011

PHOENIX REAL ESTATE MARKET REPORT - MARCH 2011


Phoenix Real Estate Market Report Summary

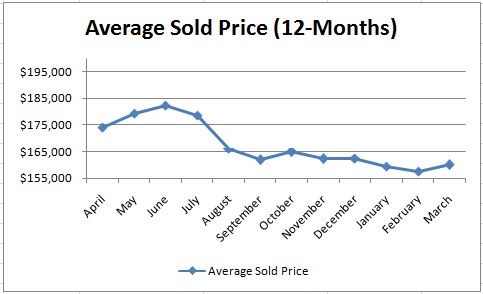
This data includes single family detached homes, patio homes, condos, and townhomes provided by the Arizona Multiple Listing Service. The monthly charts above are based on trailing twelve monthly averages from April 2010 to March 2011 which shows the total activity in the Phoenix Metropolitan real estate market over a twelve month period. The yearly charts above are based on a yearly average for 2005 to 2009 but a trailing twelve month average from April 2010 to March 2011 for the year 2011. Without the trailing twelve month average for the year 2011, the charts would be substantially skewed and would not portray an accurate view of the market on an annual basis.

Since the expiration of the first time home buyer tax credit on April 30, 2010, the real estate market has decreased in the average sold price and number of transactions. Since April 2010, the average sold price has decreased approximately -8.1% (up from last month), the average days on market have increased approximately +17.7% (down from last month) and the number of transaction has increased approximately 8.2% (up substantially from last month). Since April 2010, the number of sold bank owned foreclosures has increased approximately 15.7% (doubled since last month) and the number of short sale has increased only approximately 4% (up slightly from last month). Based on this information, it appears there is an oversupply of properties on the market and if banks continue to add more foreclosure inventory to the market, then this will continuing to cause prices to fall. It also appears demand in the market is stronger than the prior year and the results can be seen in the increased number of transactions. If demand for real estate exceeds supply, then price will start to appreciate once again. The peak buying season in the Phoenix market generally does not begin until March or April and then slows down slightly in July and August. 

The number of Notice of Trustee Sales is currently experiencing a decline due to increased government intervention to make lending institution work hard on helping people stay in their homes. The number of foreclosures “notices” entering the market is expected to decline in late 2011 and early 2012 due to the exhaustion of adjustable rate mortgages created between 2003 to 2007. Although the number of foreclosure notices will decline, there are still a lot of homeowners upside down and a lot of these homeowners will make a business decision to let their homes go into foreclosure despite the fact they can continue paying their mortgage. The number of trustee’s deeds issued at the trustee auctions is on a steep incline which means the competition for trustee properties has increased over the last two months due to the lower supply of foreclosure. There is a large amount of properties sold at the court house steps but there is still a large amount of REO properties sold through the MLS. According to the above market statistics, the demand for trustee sale foreclosures has increase substantially and the demand for REO properties is increasing. It is impossible for real estate prices to go down much further since the market will eventually reach a level of equilibrium where demand will exceed supply and all buyers will rush into the market to take advantage of low prices before the prices start to increase.  A lot of investors and home buyer have already realized that now is the best time to buyer while prices are low.