Tuesday, January 24, 2012

PHOENIX REAL ESTATE MARKET REPORT - DECEMBER 2011


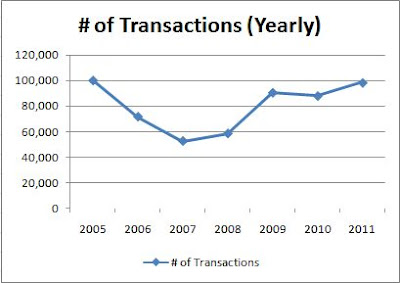
This data includes single family detached homes, patio homes, condos, and townhomes provided by the Arizona Multiple Listing Service. The monthly charts above are based on trailing twelve monthly averages from January 2011 to December 2011 which shows the total activity in the Phoenix Metropolitan real estate market over a twelve month period. The yearly charts above are based on a yearly average for 2005 to 2011.

As you can see from the first chart above, Position Realty Market Index, the first time home buyer tax credit created a great deal of demand in the market similar to the real estate boom from 2004 to 2006. When the government withdrew the first time home buyer tax credit on April 30, 2010, the average sold price and number of transactions decreased and the average days on market increased. Currently, the residential real estate market is experiences another buying frenzy that is caused without government intervention or relaxed mortgage underwriting standards. Consumers are jumping into the real estate market because market statistics are indicating the market has hit bottom and investors can purchase homes at rock bottom prices where they can rent the homes out to receive a 10% to 15% or more return on investment. In addition, the number of people losing their homes to foreclosure has caused an increase in the demand for rental properties, as can be seen in Chart #2. 

Due to the current oversupply of homes on the market, real estate prices have not increased significantly but as you can see from Chart #3 real estate prices have started to increase since October 2011. Once the supply of homes is purchased, real estate prices will start to increase at a faster pace and then it will be too late to buy. Since January 2011, the average sold price has increased approximately +3.7% (up from last month), the average days on market have decreased approximately -17.1% (down from last month) and the number of transaction has increased approximately +18.4% (up from last month). It should be noted that approximately +35% of all transaction are cash purchases either by investors or homeowners due to tighter lending requirements. The volume of REO purchases since January is down -22.9% and the volume of short sale is up +64.9%. The volume of REO purchases are shrinking due to the increased volume of trustee sales and existing supply of inventory is getting absorbed at a faster rate.        
  
The real estate market has reached a level of equilibrium where demand is equal to supply and all buyers are rushing into the market to take advantage of low prices. Once the supply of residential homes is exhausted and demand continues to increase, real estate prices will begin to rise (depends on the sustained level of demand). Trying to “time the market” for the perfect time to buy is nearly impossible but there is no better time than now to purchase. Real estate prices are at an all time low, mortgage rates are at a historical low and the market appears to be improving both in terms of prices and the overall economy. Time to buy is NOW!! Give us a call to discuss your best buying strategy, TODAY!!

Tuesday, January 17, 2012

More Cities Join 'Improving' Housing Market List

The National Association of Home Builders’ list of improving housing markets nearly doubled this month, as more cities showed signs of a rebound with their real estate markets.

The list now contains 76 improving markets, up from 41 in December, according to NAHB’s and First American’s Improving Markets Index, a monthly gauge that measures a city’s improvements in housing permits, employment, and housing prices for at least six months. 

"The fact that the list of improving housing markets nearly doubled this month shows that a significant, positive trend is developing, and is even more relevant when you consider the expanding geographic distribution of the list — which now includes 31 states and the District of Columbia," NAHB Chairman Bob Nielsen said in a statement. 

These cities were added to the list in January: 

  • Florence, Ala.
  • Tuscaloosa, Ala.
  • Fayetteville, Ark.
  • Denver, Col.
  • Greeley, Col.
  • Bridgeport, Conn.
  • New Haven, Conn.
  • Cape Coral, Fla.
  • Jacksonville, Fla.
  • Punta Gorda, Fla.
  • Honolulu, Hawaii
  • Ames, Iowa
  • Des Moines, Iowa
  • Dubuque, Iowa
  • Elkhart, Ind.
  • Indianapolis, Ind.
  • Lafayette, Ind.
  • Lake Charles, La.
  • Worcester, Mass.
  • Grand Rapids, Mich.
  • Lansing, Mich.
  • Monroe, Mich.
  • Minneapolis, Minn.
  • Columbia, Mo.
  • Joplin, Mo.
  • Fargo, N.D.
  • Manchester, N.H.
  • Cincinnati, Ohio
  • Oklahoma City, Okla.
  • Tulsa, Okla.
  • Corvallis, Ore.
  • Erie, Pa.
  • Philadelphia, Pa.
  • Chattanooga, Tenn.
  • Clarksville, Tenn.
  • Nashville, Tenn.
  • College Station, Texas
  • Dallas, Texas
  • Victoria, Texas
  • Madison, Wisc.

To view a complete list of all 76 metro areas on the Improving Markets Index CLICK HERE

Mortgage Applications Soar 4.5%

Mortgage applications for purchase -- a gauge of future home buying -- increased 8.1 percent last week, the Mortgage Bankers Association reports. The purchase index on an unadjusted basis now stands at 41.9 percent higher than last year, signaling more people taking out loans to buy homes. 

More home owners are also taking advantage of low interest rates. Refinance activity last week also increased, inching up 3.3 percent from a week earlier. Overall, mortgage applications were up 4.5 percent last week. 

For the fifth consecutive week, 30-year fixed-rate mortgages have averaged at historical lows below 4 percent, Freddie Mac reported last week. For the week ending Jan. 5, 30-year fixed-rate mortgages averaged 3.91 percent, with an average 0.8 point, matching the previous record low set a few weeks ago. 

Demand For Rental Properties - Are There Too Many Rentals

Since January 2011, investors have been purchasing rental properties in the Phoenix market like crazy! The price of single family homes, condos, townhouses and patio homes have reached a level where an investor can purchase these properties, rent them out and receive a 10% or more return on their investment per year. Investors will continue purchasing properties until they are no longer able to receive this kind of high return on investment. There is still a great deal of properties for sale on the market and in certain areas prices have gone up. Below is a chart showing the number of landlord purchases within in the market:


In addition to real estate investors, many homeowner have decided to rent their homes instead of letting them go into foreclosure. Many people have let their homes go into foreclosure and these people still need a place to live. These people will more than likely want to stay in the same area where their children are going to school. There is a great deal of demand for rental properties but supply could exceed demand in 2012.

Could the rental market in Phoenix become over supplied with rentals? It is possible if investor continue to purchase properties at the same level they have in 2011. Currently, the commercial office market is experiencing decreasing rental rates due to the over supply of offices build in the market. The same thing could happen with the residential markets if investors don't stop buying.

Once rental rates start dropping, then these investors will not receive the same kind of returns they originally hoped for in the Phoenix Market. Also, the people trying to hold on to their homes will be forced to lower their rents and eventually have to let the home go into foreclosure.

Hiring a competent property management to make sure you are receiving the highest amount of rental income for your property and making sure the tenant will take good care of your property before you give them your keys is very important. Give us a call TODAY to discover how we can help you SAVE money!!

4 Ways to ID Borrower Assistance Scammers

Scammers have targeted delinquent borrowers during the past few years, hoping to take advantage of their desperation and financial inexperience. Their approach typically involves posing as a representative of a nonprofit or government agency who can help with a loan modification or some other form of assistance.

Sheri Stuart, education manager at Springboard Nonprofit Consumer Counseling, says she frequently encounters consumers at courses offered by her organization who have been victimized by these scams. Stuart says she recently met a couple from Southern California at one of these events who’d paid $3,000 to a fraudulent company in an attempt to keep their home out of foreclosure.

“It’s disconcerting,” she says. “It has a ripple effect. It not only affects the home owners, it affects the communities as well.”

To keep more consumers from being taken in by these scams, Stuart offers the following four red flags to help determine whether borrowers’ knight in shining armor is actually a swindler on the make:

1. They ask for money up front. “That’s usually an indication that someone has an ulterior motive,” Stuart says.

2. “Phantom help” appears out of nowhere. If a consumer hasn’t proactively contacted anyone about missed mortgage payments, but suddenly gets calls and mail about getting help for missed mortgage payments, it’s probably a scammer.

3. They present phony credentials. Many companies that claim to offer assistance will have official-looking seals from credentialing institutions on paperwork, promotional materials, and Web sites. Research those organizations to make sure they actually exist.

4. They make promises they can’t deliver. If they make ambitious guarantees about being able to modify loans or halt foreclosures, that should set off alarm bells. “Nobody can promise you a loan mod,” Stuart says.

If your you suspect you have been targeted, contact Loanscamalert.org to get more information and report the scammers.

Foreign Buyers See Big Bargains in U.S. Real Estate

Foreign investors are finding plenty of deals in the U.S. when it comes to real estate, and, as such, more international investors are flocking to key states to buy their piece of the American Dream.

Mexico is the top country of origin for foreign buyers purchasing U.S. homes, according to a recent study by Credit Sesame, which used National Association of REALTORS® data for its findings.

“In this period of tremendous uncertainly globally, real estate here is a safe haven,” Susan Wachter, professor of real estate and finance at University of Pennsylvania, told MSNBC.com.

The top destinations of foreign investors for U.S. real estate purchases are:

1. Florida: 31 percent of all home purchases in that state are made by foreign buyers, with most coming from Cuba, Haiti, and Colombia.

2. California: 12 percent of all home purchases (most coming from Mexico, the Philippines, China, India, and Vietnam)

3. Texas: 9 percent of all home purchases (most coming from Mexico, India, Vietnam, China, and the Philippines)

4. Arizona: 10 percent of all home purchases (most coming from Mexico, India, China and Canada)